Cloud Guru Challenge - October 2020
Background
- Goal: Build a Netflix Style Recommendation Engine with Amazon SageMaker
- Outcome: Gain real machine learning and AWS skills while getting hands-on with a real-world project to add to your portfolio https://acloudguru.com/blog/engineering/cloudguruchallenge-machine-learning-on-aws
TL;DR:
I built:
- Movie Recommendation Engine (K-Means clustering using AWS SageMaker)
- Serverless API and Website for users to view recommendations for selected movies (using API Gateway, Lambda, DynamoDB, S3 & CloudFront)
- Visit https://moviesforme.net/ to try out the recommendations!
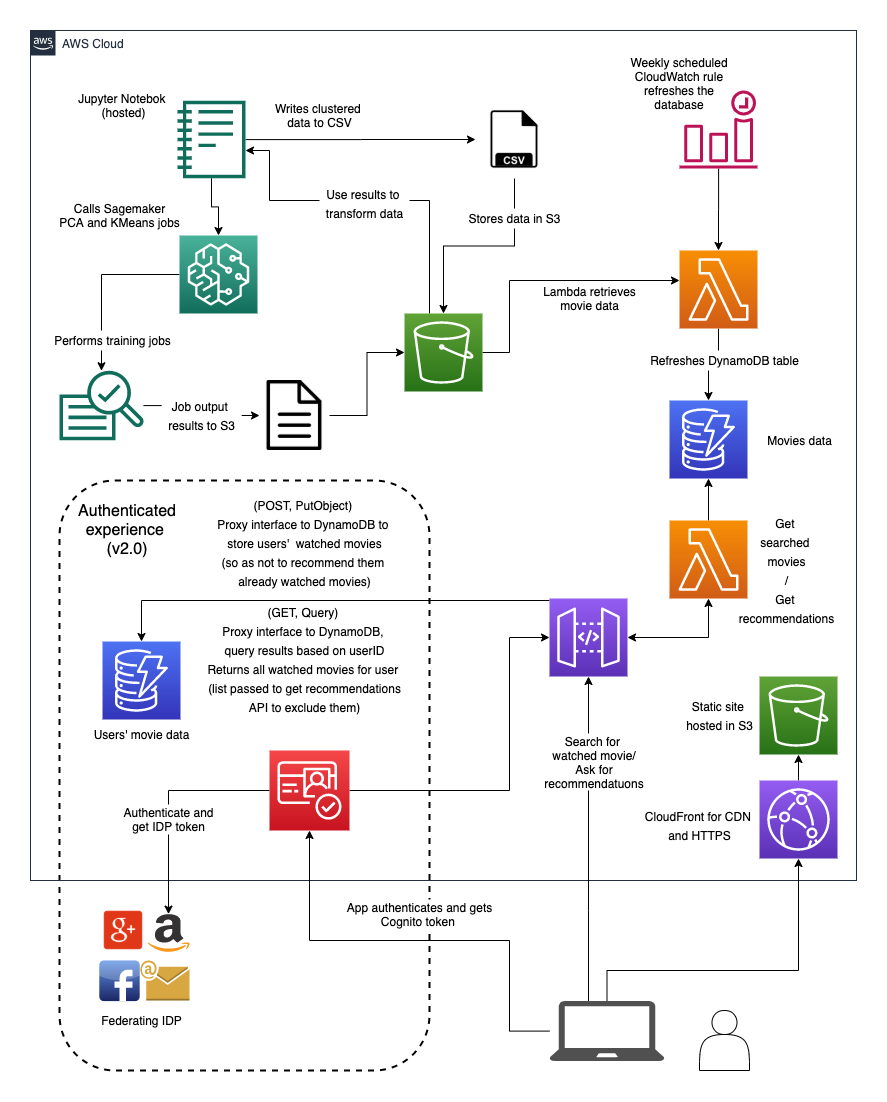
Here’s the architecture I implemented:
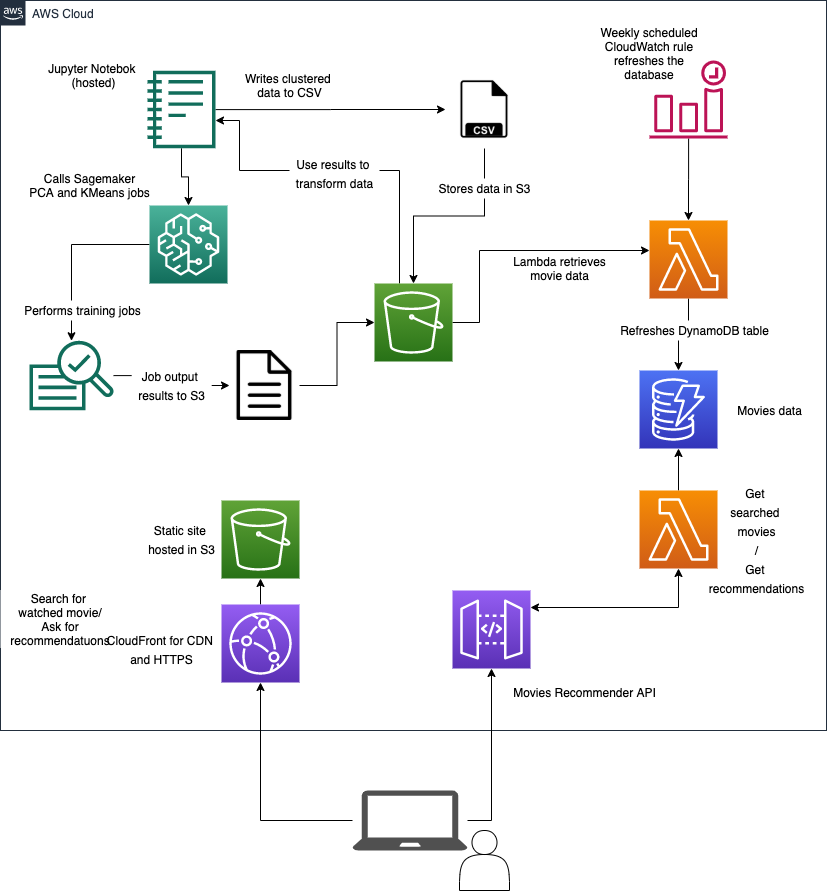
Machine Learning in the Cloud
Steps
1. Determine use case and obtain data.
I thought about using GoodReads data to build a book recommendation engine, moreso because it would be a point of differentiation. However, my interests align with TV and film more than literature, so I decided movie datasets will be a better fit for me.
The first decision to make was to do with what data to use. In the brief, Kesha Williams made the example suggestion of movie datasets from IMDB.
The datasets are all available for download here: https://datasets.imdbws.com/
The recommended sets to use by Kesha were the title.akas (for grouping alternate titles’ info), title.basics (basic information about the titles) and title.ratings (rating information for the titles). These could all be merged on the “titleid” column. I used the ‘requests’ python library to download these, and then converted to Pandas dataframes for analysis / ML training.
A further dataset that was considered for use was name.basics. This data shows actors (and relevant info) and some titles (csv of titleid values) that the actor is known for. This information would be very useful.
Other information could be easily scraped from imdb itself, such as plot, reviews, etc. While this information is most likely going to improve the quality of the recommendations, the type of Machine Learning required to do this is beyond the scope of this exercise.
In general, there’s a few main main ways of grouping this type of data for recommendations: (a) Simple recommendations. Recommending the same items regardless of user, normally based on highest rating, or sales data. (b) Content based filtering. The first of these is finding commonalities about data attributes, e.g. movie genre’s, actors, plot, ratings. (c) Collaborative filtering. This is more user behaviour driven, grouping data based on interactions (simliar ratings for one title would group allow for recommending another one)
The data that I selected will allow for some fairly simple content-based filtering.
2. Create Jupyter hosted notebook
My experience with Jupyter is pretty minimal. I’d played with it very briefly when doing a AWS DeepRacer lab over a year ago now. I wanted to get a good understanding of how Jupyter works, so I did the following course on A Cloud Guru: https://learn.acloud.guru/course/introduction-to-jupyter-notebooks
I installed Jupyter on my local machine to begin with and to learn about how the notebooks work.
A really cool advantage of Jupyter notebooks is the reproducable nature of the runs, meaning anyone can run the same experiment, even when the underlying data changes.
The course was a very interesting introduction to some of the good data science tools that are available in Python, as well as how to use hosted notebooks in the cloud.

I highly recommend this course if you’re keen on learning how to use Jupyter.
While I’m on th subject, the real advantage of using Jupyter is that you can perform data science experiments and ML training using resources that you normally wouldn’t have access to, and only need to pay for the infrastructure as you use it!
Being able to see visualisations generated inline with the code is really adventageous as well, making the connection between the context, the code and information really straight-forward.
However, a downfall of running data science scripts on AWS hosted infrastructure is the cost. Pandas loads dataframes into memory (much like other statistics software) and more data means bigger instance type. To load the data I chose, I required an instance type of ml.t2.xlarge… not a cheap instance. Couple that with the cost of SageMaker instances, and costs can quickly add up, especially if you’re just doing this as a training exercise (excuse the pun!).
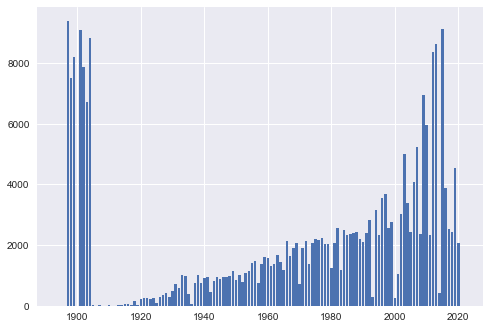
3. Inspect and visualize data
To understand what the data I got meant, I used Pandas and MatPlotLib Python libraries for analysing and visualising the data.
The real value of this is to see the relationship between different variables. A good example of this is to see number of titles in the data vs. year of realease for each movie.
   plt.bar(df_titles.year.unique(),
         df_titles.year.value_counts().sort_index())
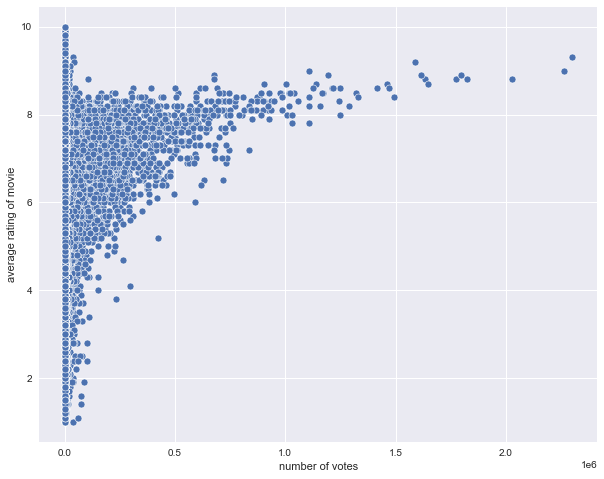
Other good relationships to view is between number of votes per title vs. the average rating.
   plt.figure(figsize = (10,8))
   sns.scatterplot(x = df_titles['numvotes'], y = df_titles['averagerating'])
   plt.xlabel('number of votes')
   plt.ylabel('average rating of movie')
4. Prepare and transform data
As I was, previous to this challenge, unfamiliar with AWS SageMaker and K-Means Clustering, I used the following AWS provided example Jupyter Notebook as a guide on performing my own clustering: https://github.com/aws/amazon-sagemaker-examples/blob/master/introduction_to_applying_machine_learning/US-census_population_segmentation_PCA_Kmeans/sagemaker-countycensusclustering.ipynb
The information in the data is quite useful for classifying movies. Columns such as ‘genres’ allows us to see movies with th same genre, for instance, which is likely going to be a solid basis for grouping movies. However, K-Means clustering algorithms don’t work with descriptive data, so we need to transform the data.
The genres column contains CSV data of the genres for each movie. Each movie can have no, one, or several genres.
There’s many different permutations (1258 unique combinations) of genres that exist for the dataset:
   # we can see there's lots of unique values, as each genre can be combined with others
   df_titles.genres.unique()
   array(['Romance', 'Biography,Drama', '\\N', ..., 'Fantasy,History,War',
         'Documentary,Family,Sci-Fi', 'Horror,Musical,Thriller'],
         dtype=object)
   df_titles.genres.unique().shape
   (1258,)
To convert this to data that an ML-algorithm can use, we need to transform it. Firstly, I converted the CSV data to a list of strings:
   # let's convert the csv column to a pandas list object in a new column
   df_titles['genres_list'] = df_titles.genres.str.split(',').tolist()
And then used the Pandas ‘get_dummies()’ function to perform ‘One-Hot-Encoding’ on the individual genres
   # get the one hot encoded values for genre.
   # (this table is relatively sparse)
   genres_one_hot_encoded = df_titles.genres_list.str.join('|').str.get_dummies().add_prefix('genre_')
   genres_one_hot_encoded.shape
   (254179, 29)
   genres_one_hot_encoded.head()
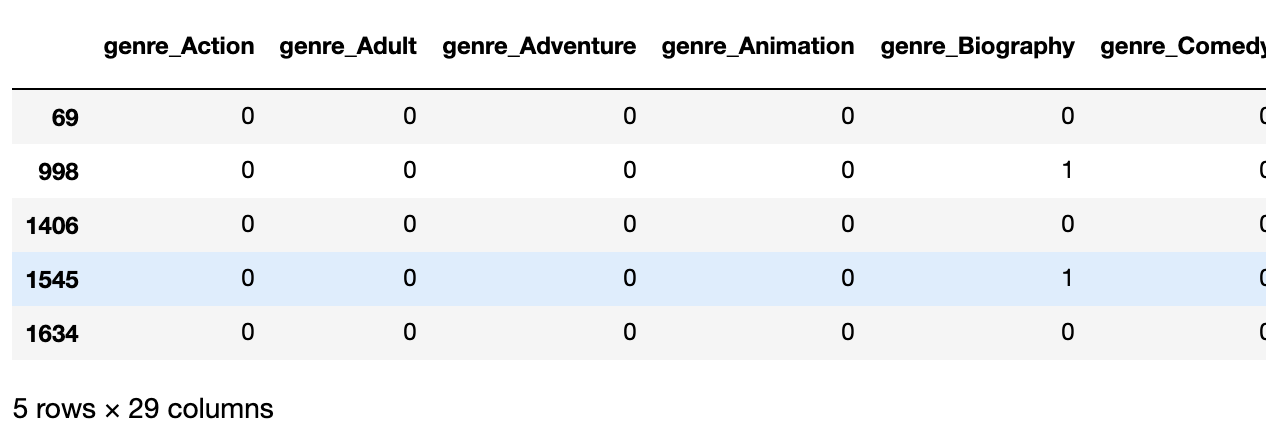
From this, we’ve binarised the data for each genre, where each a movie gets a ‘1’ if it has that as a genre, and ‘0’ if it’s absent. We can also see that the number of unique genres is actually only 29 elements long, which is a bit reduction from 1258! We can then join this data to the main dataframe, and drop the existing descriptive columns, as well as the one-hot-encoded columns for n/a or null values (in the IMDB dataset, these are represented by ‘\N’). This process can be repeated for any descriptive attribute. In my example data, I also included movie language, although this didn’t need string splitting first.
Now the data for the other numerical attributes (runtime, number of votes and average rating) can be scaled using MinMaxScaler. We need to standardise the scaling of the numerical columns in order to use any distance based analytical methods so that we can compare the relative distances between different feature columns.
   scaler=MinMaxScaler()
   df_titles_scaled=pd.DataFrame(scaler.fit_transform(df_titles))
   df_titles_scaled.columns=df_titles.columns
   df_titles_scaled.index=df_titles.index

   df_titles_scaled.describe()
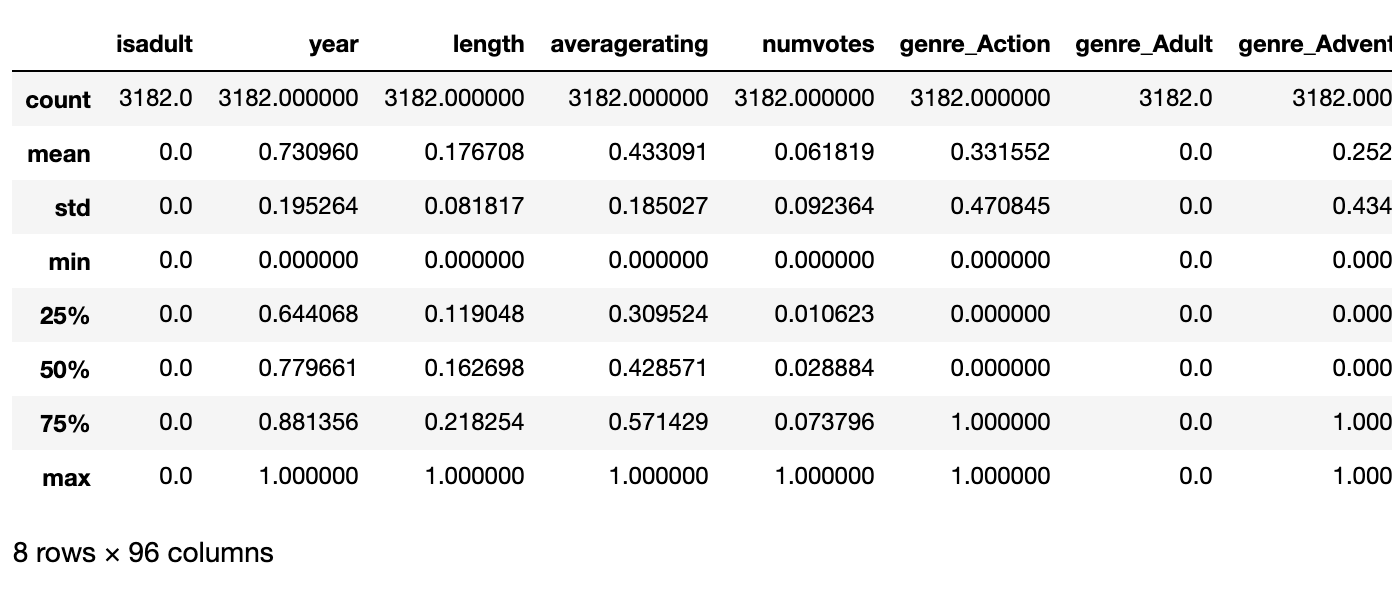
The dimensionality of the data is then really large (95 columns!). I used principal component analysis (PCA) to reduce the dimensionality of the data.
   num_components=95

   pca_SM = PCA(role=role,
      instance_count=1,
      instance_type='ml.c4.xlarge',
      output_path='s3://'+ bucket_name +'/titles/',
      num_components=num_components)
I then used the PCA job output to transform the original data. Once transformed, it was ready for training!
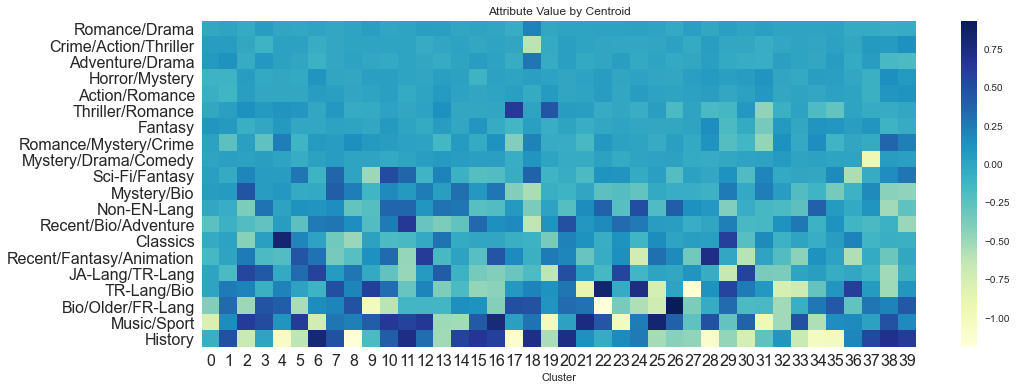
When viewing what attributes make up the components found, it’s mostly Genre, with some variation based on release year, language and popularity.
5. Train
Once the data is transformed, I was able to call through to the Python Sagemaker library to perform segmentation using unsupervised clustering, like this:
   import sagemaker
   from sagemaker import KMeans

   num_clusters = 40
   kmeans = KMeans(role=role,
                  instance_count=1,
                  instance_type='ml.c4.xlarge',
                  output_path='s3://'+ bucket_name +'/titles/',
                  k=num_clusters)
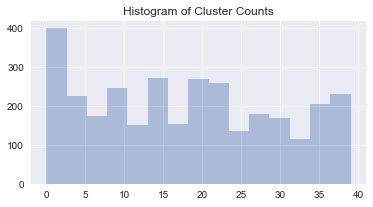
After this has been run, the original data can have the cluster label mapped back to it. The distrbution of the clusters looks like so:
6. Recommend
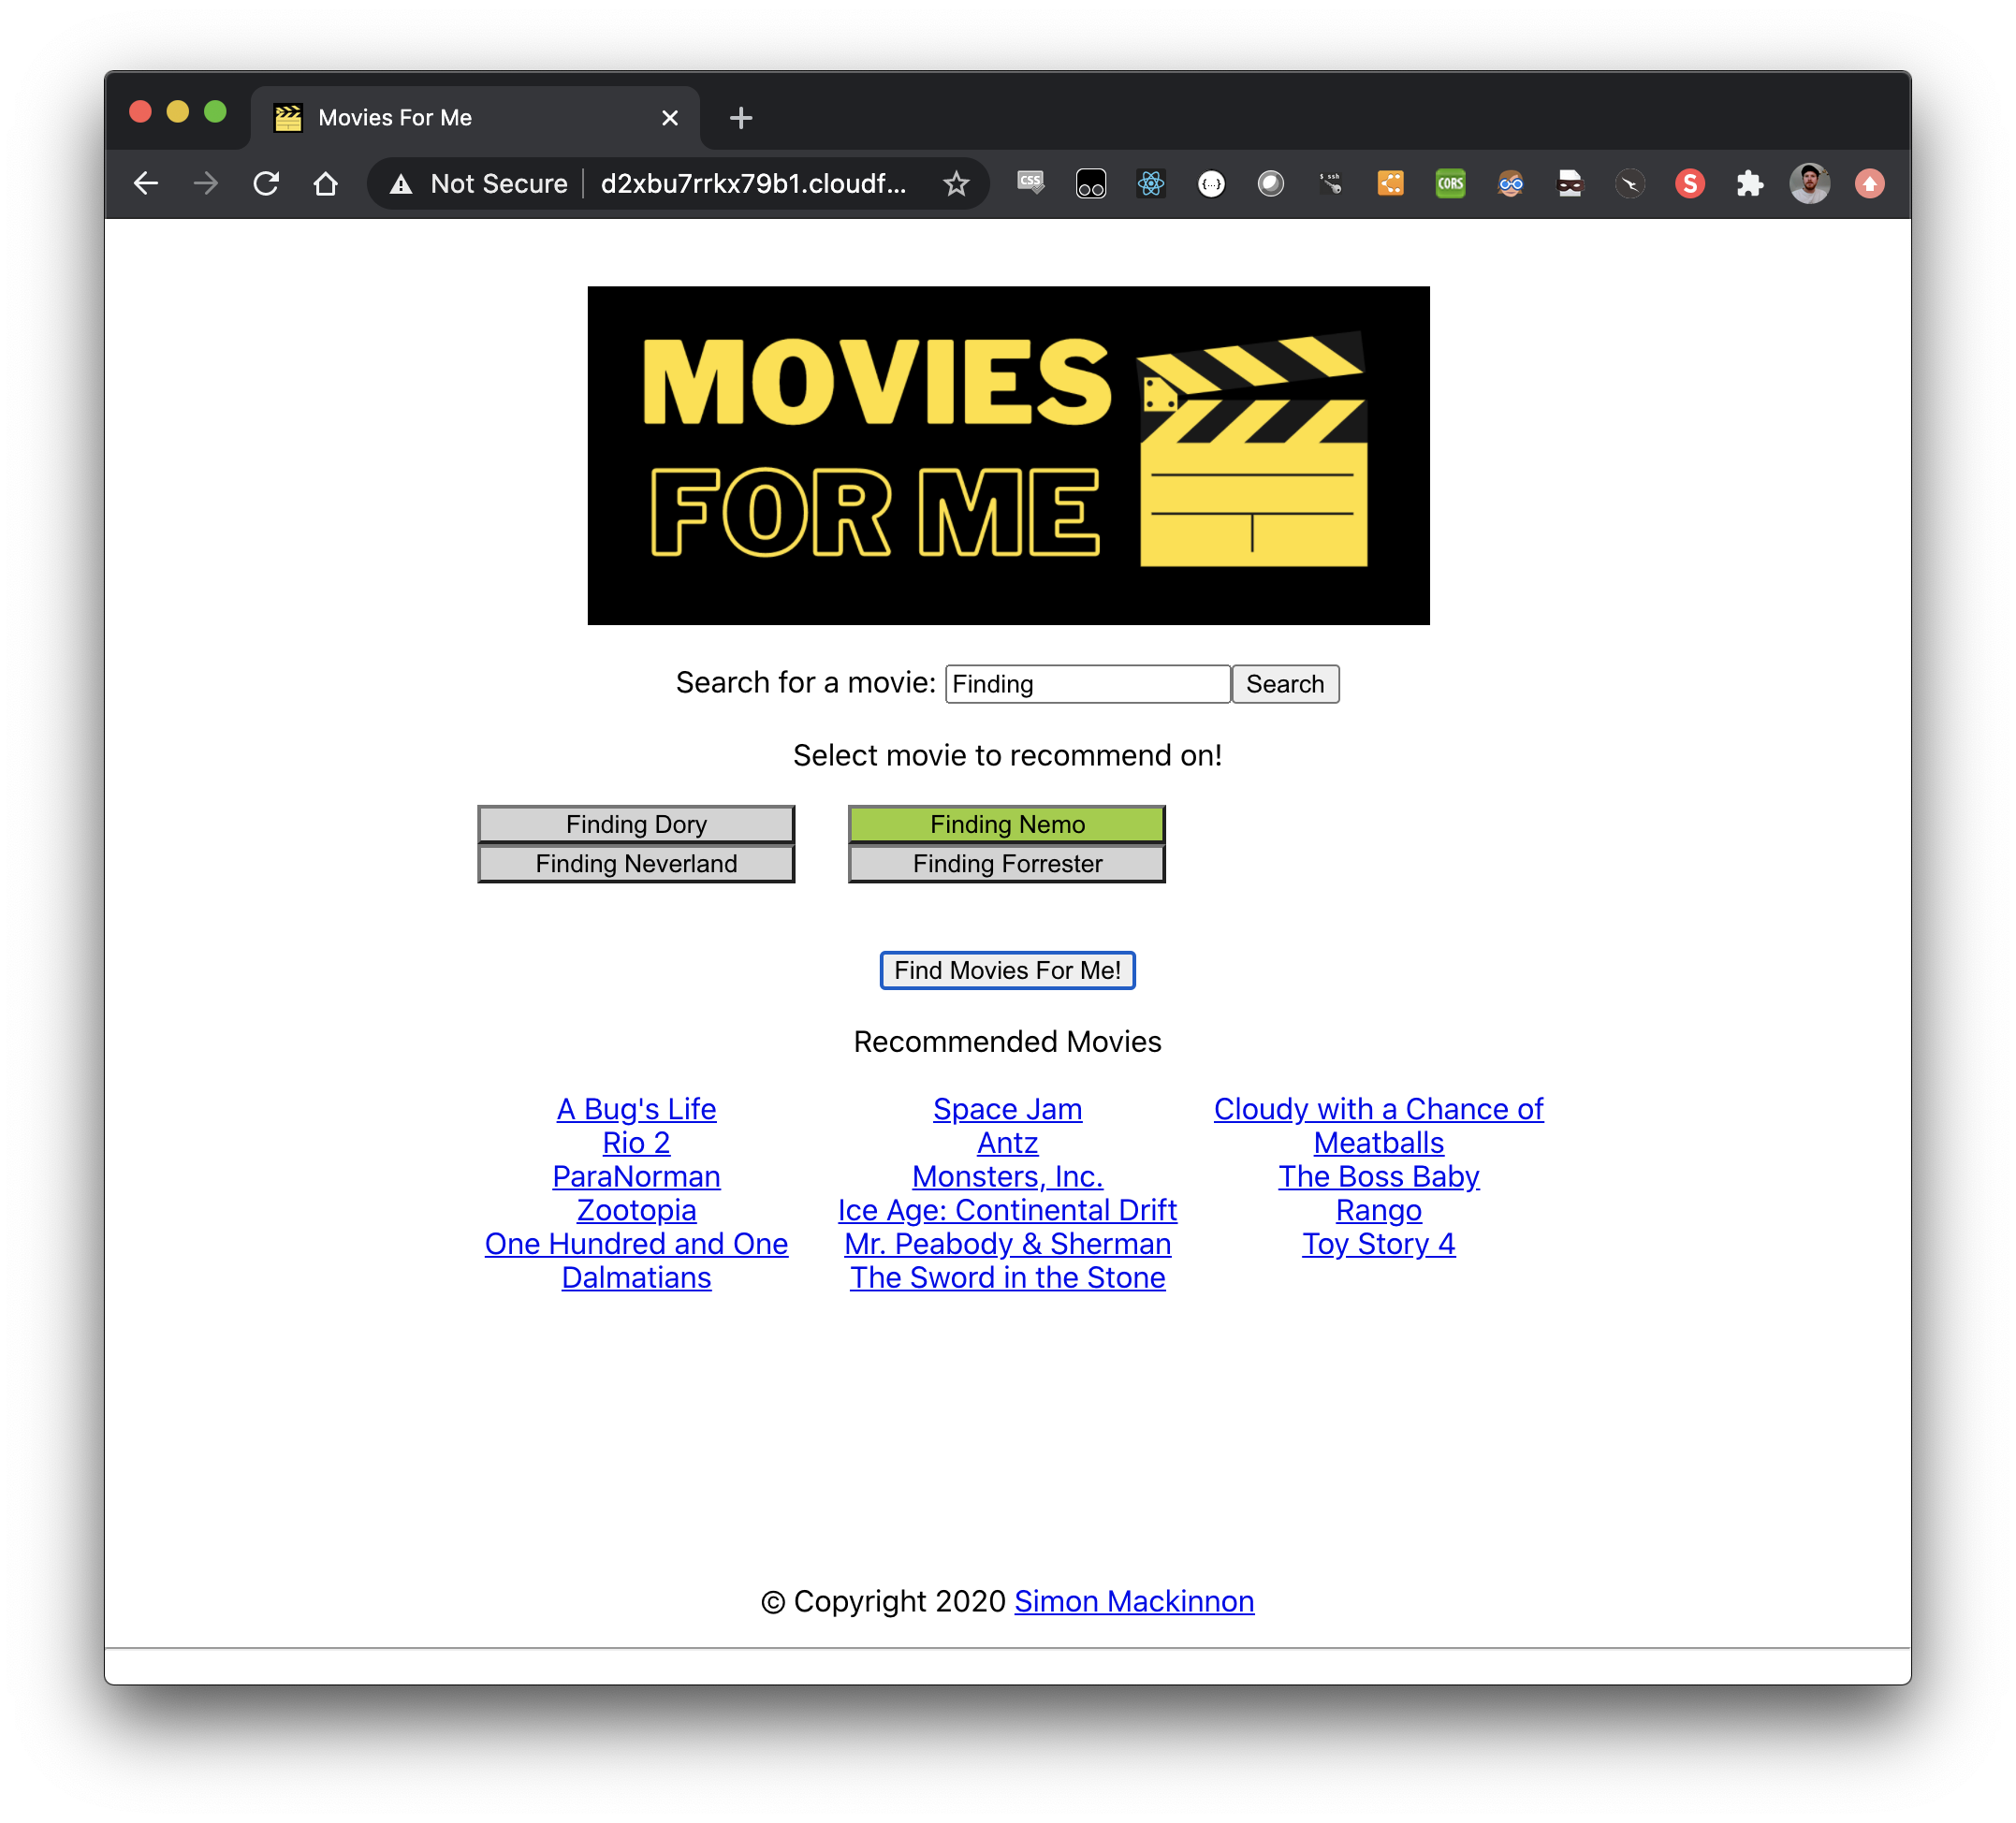
I wanted to present the outcome of the recommendation engine to real users. For this, I needed a website, or at a minimum, an API.
The basic flow of this information is:
- Sagemaker Notebook writes trained model to CSV file in S3 Bucket
- Scheduled Lambda loads CSV data into DynamoDB table
- API Gateway using Lambda proxy queries the data to find titles and return a sample of titles in the same cluster as the chosen title.
- Static React JS website (hosted in S3, served up via CloudFront) allows users to search for movies and request recommendations based on this. Don’t judge on the styling!
7. Source control
You can view all the code for the training notebook, app infrastructure and API/website here:
https://github.com/simonmackinnon/cloudguruchallenge-2020-10
8. Clean up resources
When dealing with Machine Learning, instances and SageMaker endpoints can bear large costs very quickly. An important thing to check is the “Endpoints” in the Sagemaker console. I’ve added code at the end of the Notebook to delete the endpoints.
sagemaker.Session().delete_endpoint(kmeans_predictor.endpoint)
However, if there is an error earlier on, it’s worth manually checking that the endpoints really are deleted!
The Notebook instance sise is also considerable. It’s REALLY worth stopping it when not in use. Or, you can run it on your local machine if it has the required memory resources (my MacBook Pro has 16GB RAM, which is more than enough for this exercise). If you’re planning on doing that, make sure that the configured AWS user that you use on your machine has the ability to assume into the SageMaker execution role (the jobs require you to pass it in as a variable)
9. Impovements
At the start of this blog I included an architecture diagram for the whole solution. I also proposed a second version of the application, which would allow users to log into the website, select movies they had previously watched (stored in DynamoDB) and filter those movies out of the recommended results. Here’s an example of how this would work:
Another improvement I’d make would be to add CodeBuild jobs for automated deployments. I didn’t set up a CI/CD pipeline for anything, so this will definitely be part of V2!
I wanted to include Movie posters in the recommendations and title searches. While this information is obtainable via web-scraping of IMDB, or 3rd-party API calls, tying these calls into the API for title recommendations really slowed the site down. I have some ideas for how this would work, namely storing the images in S3 for all titles, iterating over the records in the database using step functions.
Finally, a major imporovement I’d make would be to the clustered data. I think using some Natural Languange Processing to group movie titles based on plot text would be a fantastic way to approach this. Another way would be to get user rating and viewing data and perform collaborative clustering.
If You’re on the Machine-Learning Journey, Take The Train
I’m really a Machine Leanring and Data Science beginner. That being said, the documentation and (especially) the out-of-the-box tools that AWS SageMaker provides for performing Machine Learning are REALLY awesome!
I had a fantastic time learning about what’s required to get data ready for training, what the outputs of ML jobs means, and particularly, validating how good my model is.
There’s a lot more involved in getting this all working, so please reach out if there’s anything in the code that you want me to explain, or provide references for!
References:
- https://github.com/aws/amazon-sagemaker-examples/tree/master/introduction_to_applying_machine_learning/US-census_population_segmentation_PCA_Kmeans
- https://longjp.github.io/statcomp/projects/clusteringimdb.pdf
- https://www.imdb.com/interfaces/
- https://learn.acloud.guru/course/introduction-to-jupyter-notebooks
- https://pandas.pydata.org/pandas-docs/stable/reference/api/pandas.get_dummies.html